Remote system health monitoring and data analysis for single radars and multi-radar networks
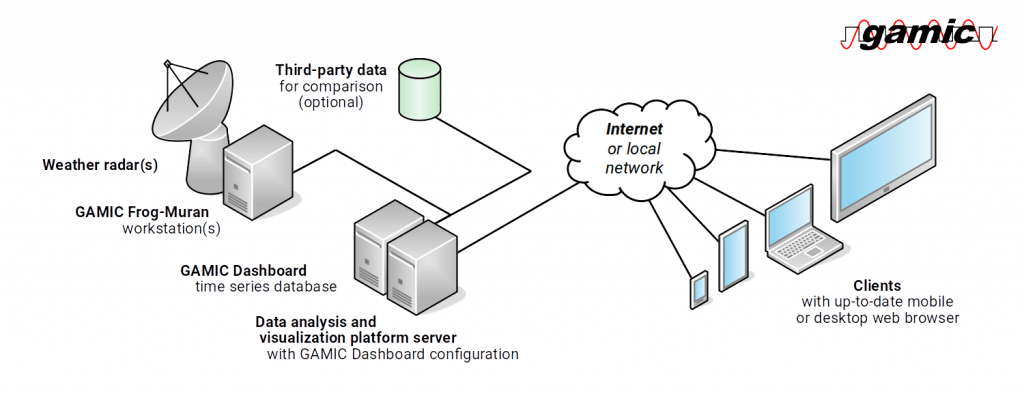
GAMIC Dashboard is an easy-to-use and yet comprehensive browser-based remote monitoring and analysis tool for your weather radar system health and output data. The backend uses a powerful time series database while the frontend is based on a widely-used interactive web platform.
Real-time and long-term monitoring
Radar systems need thorough monitoring but radar observation and control applications often provide much information at various places. GAMIC Dashboard is the perfect supplement for your Frog-Muran weather radar software suite. It provides a simple and yet powerful overview of all important system health parameters from both single radar sites and radar networks, accessible from any device with a web browser.
Check your current radar status indicators at a glance, analyze special events, compare different parameters and learn about their association, or scroll through the past development of any BITE item value or other sensor data. GAMIC Dashboard helps you to know your radar system better and to catch hardware issues early.
Statistical ouptut data analysis
With GAMIC Dashboard it is easy to automatically analyze the temporal development and statistics of any single and dual polarization moment. Keep your radar data reliable and reproducable. For example, an integrated single-point analysis allows for the observation of clutter power development of known clutter targets. This way, the loss of transmission power (e.g. due to a parting magnetron) can be detected early.
Did you know that you can flexibly visualize and easily investigate your radar products in any web browser with GAMIC Webview?
Data comparison with other sources
To get more insight in your radar data, you can compare it with data from other sources. Combine data from additional weather radars, lidars, profilers, gauges, or any other instrument which is suitable for a comparison with your data.
Dashboard setup

